Introduction
This article presents the NPLS results of the AP dataset discussed in Chapter 7 of my dissertation.
Preamble
library(dplyr)
#>
#> Attaching package: 'dplyr'
#> The following objects are masked from 'package:stats':
#>
#>     filter, lag
#> The following objects are masked from 'package:base':
#>
#>     intersect, setdiff, setequal, union
library(tidyr)
library(parafac4microbiome)
library(NPLStoolbox)
library(CMTFtoolbox)
#>
#> Attaching package: 'CMTFtoolbox'
#> The following object is masked from 'package:NPLStoolbox':
#>
#>     npred
#> The following objects are masked from 'package:parafac4microbiome':
#>
#>     fac_to_vect, reinflateFac, reinflateTensor, vect_to_fac
library(ggplot2)
library(ggpubr)
testMetadata = function(model, comp, metadata){

  transformedSubjectLoadings = model$Fac[[1]][,comp]
  transformedSubjectLoadings = transformedSubjectLoadings / norm(transformedSubjectLoadings, "2")

  metadata = metadata$mode1 %>% left_join(ageInfo, by="SubjectID") %>% mutate(Gender=as.numeric(as.factor(Gender), PainS_NopainA=as.numeric(as.factor(PainS_NopainA))))
  result = lm(transformedSubjectLoadings ~ Gender + Age + PainS_NopainA, data=metadata)

  # Extract coefficients and confidence intervals
  coef_estimates <- summary(result)$coefficients
  conf_intervals <- confint(result)

  # Remove intercept
  coef_estimates <- coef_estimates[rownames(coef_estimates) != "(Intercept)", ]
  conf_intervals <- conf_intervals[rownames(conf_intervals) != "(Intercept)", ]

  # Combine into a clean data frame
  summary_table <- data.frame(
    Term     = rownames(coef_estimates),
    Estimate = coef_estimates[, "Estimate"] * 1e3,
    CI       = paste0(
                 conf_intervals[, 1], " – ",
                 conf_intervals[, 2]
               ),
    P_value  = coef_estimates[, "Pr(>|t|)"],
    P_adjust = p.adjust(coef_estimates[, "Pr(>|t|)"], "BH"),
    row.names = NULL
  )

  return(summary_table)
}
cytokines_meta_data = read.csv("./AP/input_deduplicated_metadata_RvdP.csv", sep=" ", header=FALSE) %>% as_tibble()
colnames(cytokines_meta_data) = c("SubjectID", "Visit", "Gender", "Age", "Pain_noPain", "case_control")
ageInfo = cytokines_meta_data %>% select(SubjectID, Age) %>% unique()
# Full cohort
processedCytokines_full = CMTFtoolbox::Georgiou2025$Inflammatory_mediators
processedCytokines_full$data = log(processedCytokines_full$data + 0.005)

# Remove outlier subjects: A11-8
processedCytokines_full$data = processedCytokines_full$data[-25,,]
processedCytokines_full$mode1 = processedCytokines_full$mode1[-25,]

processedCytokines_full$data = multiwayCenter(processedCytokines_full$data, 1)
processedCytokines_full$data = multiwayScale(processedCytokines_full$data, 2)

# Control only subcohort
processedCytokines_control = CMTFtoolbox::Georgiou2025$Inflammatory_mediators

mask = processedCytokines_control$mode1$case_control == "control"
processedCytokines_control$data = processedCytokines_control$data[mask,,]
processedCytokines_control$mode1 = processedCytokines_control$mode1[mask,]

processedCytokines_control$data = log(processedCytokines_control$data + 0.005)
processedCytokines_control$data = multiwayCenter(processedCytokines_control$data, 1)
processedCytokines_control$data = multiwayScale(processedCytokines_control$data, 2)

# Case only subcohort
processedCytokines_case = CMTFtoolbox::Georgiou2025$Inflammatory_mediators

mask = processedCytokines_case$mode1$case_control == "case"
processedCytokines_case$data = processedCytokines_case$data[mask,,]
processedCytokines_case$mode1 = processedCytokines_case$mode1[mask,]

# Also remove subject A11-8 due to being an outlier
processedCytokines_case$data = processedCytokines_case$data[-25,,]
processedCytokines_case$mode1 = processedCytokines_case$mode1[-25,]

processedCytokines_case$data = log(processedCytokines_case$data + 0.005)
processedCytokines_case$data = multiwayCenter(processedCytokines_case$data, 1)
processedCytokines_case$data = multiwayScale(processedCytokines_case$data, 2)
Y = as.numeric(as.factor(processedCytokines_full$mode1$case_control))
Ycnt = Y - mean(Y)
Ynorm_full = Ycnt / norm(Ycnt, "2")

Y = as.numeric(as.factor(processedCytokines_case$mode1$PainS_NopainA))
Ycnt = Y - mean(Y)
Ynorm_case = Ycnt / norm(Ycnt, "2")
Inflammatory mediators
NPLS was next applied to the inflammatory mediator data to supervise the decomposition using pain perception as the dependent variable (y). The model selection procedure indicates that a one-component NPLS model corresponded to the RMSECV minimum, explaining 8.6% of the variation in X and 39.6% of the variation in y, respectively. The commented code below performs the procedure, and is not rerun here due to computational limitations.
# CV_cyto_case = NPLStoolbox::ncrossreg(processedCytokines_case$data, Ynorm_case, maxNumComponents = 10)
#
# a=CV_cyto_case$varExp %>% pivot_longer(-numComponents) %>% ggplot(aes(x=as.factor(numComponents),y=value,col=as.factor(name),group=as.factor(name))) + geom_line() + geom_point() + xlab("Number of components") + ylab("Variance explained (%)") + theme(legend.position="none")
# b=CV_cyto_case$RMSE %>% ggplot(aes(x=as.factor(numComponents),y=RMSE,group=1)) + geom_line() + geom_point() + xlab("Number of components") + ylab("RMSECV")
# ggarrange(a,b)
# npls_cyto_case = NPLStoolbox::triPLS1(processedCytokines_case$data, Ynorm_case, 3)
npls_cyto_case = readRDS("./AP/NPLS_cyto_case.RDS")

npls_cyto_case$varExpX
#> [1] 8.573875
npls_cyto_case$varExpY
#> [1] 39.61788
As expected, MLR analysis revealed that the NPLS component captured variation exclusively associated with pain perception.
testMetadata(npls_cyto_case, 1, processedCytokines_case)
#>             Term    Estimate                                         CI
#> 1         Gender  99.8790019    -0.0346956824037767 – 0.234453686164855
#> 2            Age  -0.6509257 -0.00534684820451252 – 0.00404499682719615
#> 3 PainS_NopainAS 244.6618136      0.109401050377215 – 0.379922576745903
#>       P_value    P_adjust
#> 1 0.137657084 0.206485626
#> 2 0.775969244 0.775969244
#> 3 0.001147085 0.003441254
a = processedCytokines_case$mode1 %>%
  mutate(Comp1 = npls_cyto_case$Fac[[1]][,1]) %>%
  ggplot(aes(x=as.factor(PainS_NopainA),y=Comp1)) +
  geom_boxplot() +
  geom_jitter(height=0, width=0.05) +
  stat_compare_means(comparisons=list(c("A", "S")),label="p.signif") +
  xlab("") +
  ylab("Loading") +
  scale_x_discrete(labels=c("Asymptomatic", "Symptomatic")) +
  theme(text=element_text(size=16))

temp = processedCytokines_case$mode2 %>%
  as_tibble() %>%
  mutate(Component_1 = npls_cyto_case$Fac[[2]][,1]) %>%
  arrange(Component_1) %>%
  mutate(index=1:nrow(.))

b=temp %>%
  ggplot(aes(x=as.factor(index),y=Component_1)) +
  geom_bar(stat="identity",col="black") +
  scale_x_discrete(label=temp$name) +
  xlab("") +
  ylab("Loading") +
  scale_x_discrete(labels=c("OPG", "IL-6", "IL-10", expression(IFN-gamma), "GM-CSF", expression(IL-1*beta), "VEGF", "IL-4", expression(IL-1*alpha), "IL-17A", "IL-12p70", "IL-8", "CRP", expression(MIP-1*alpha), expression(TNF-alpha), "RANKL")) +
  theme(text=element_text(size=16),axis.text.x = element_text(angle = 90, vjust = 0.5, hjust=1))
#> Scale for x is already present.
#> Adding another scale for x, which will replace the existing scale.

c = npls_cyto_case$Fac[[3]][,1] %>% as_tibble() %>% mutate(value=value) %>% mutate(timepoint=c(-6,-3,0,1,6,13)) %>% ggplot(aes(x=timepoint,y=value)) + geom_line() + geom_point() + xlab("Time point [weeks]") + ylab("Loading") + ylim(0,1) + theme(text=element_text(size=16))

a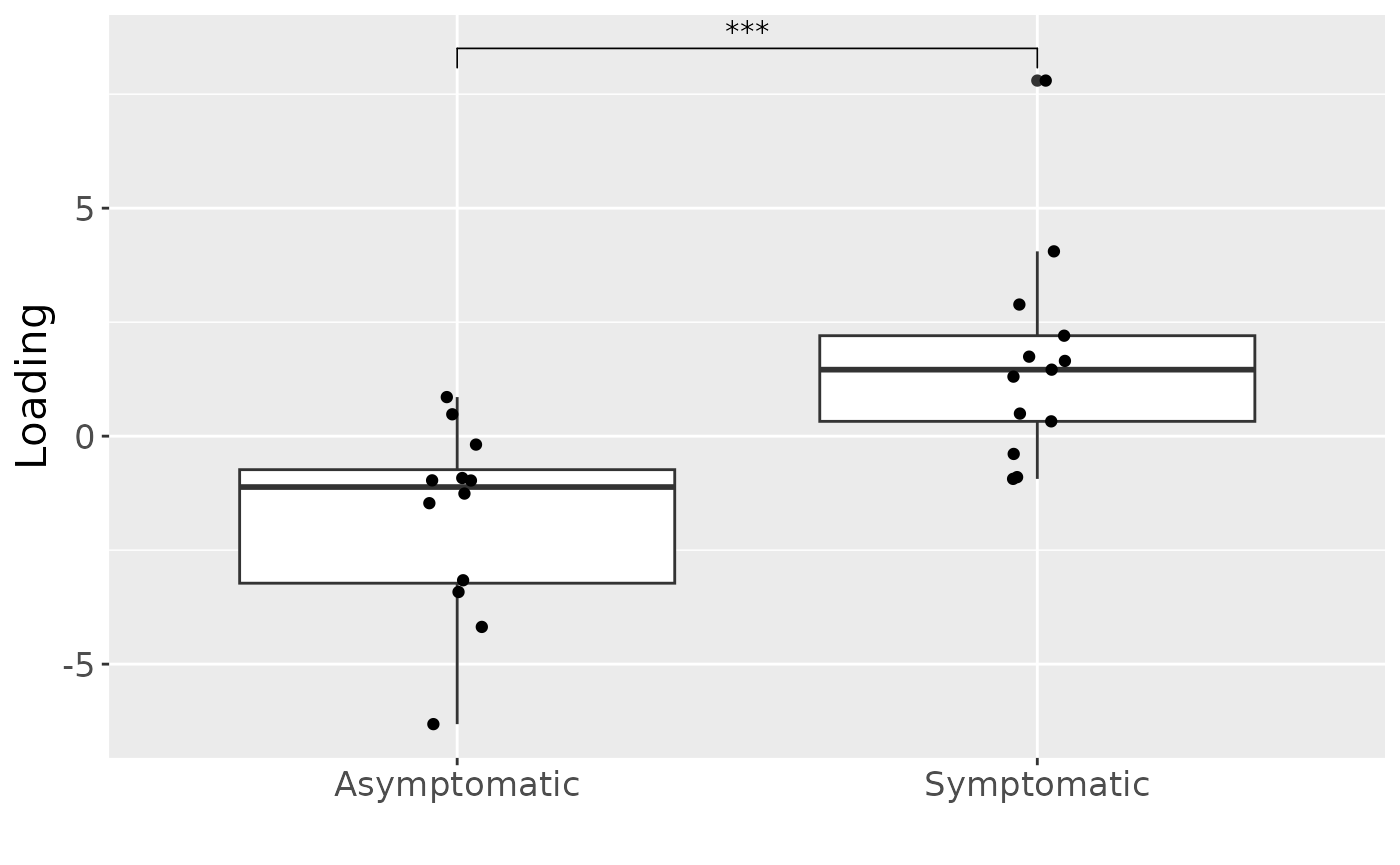
b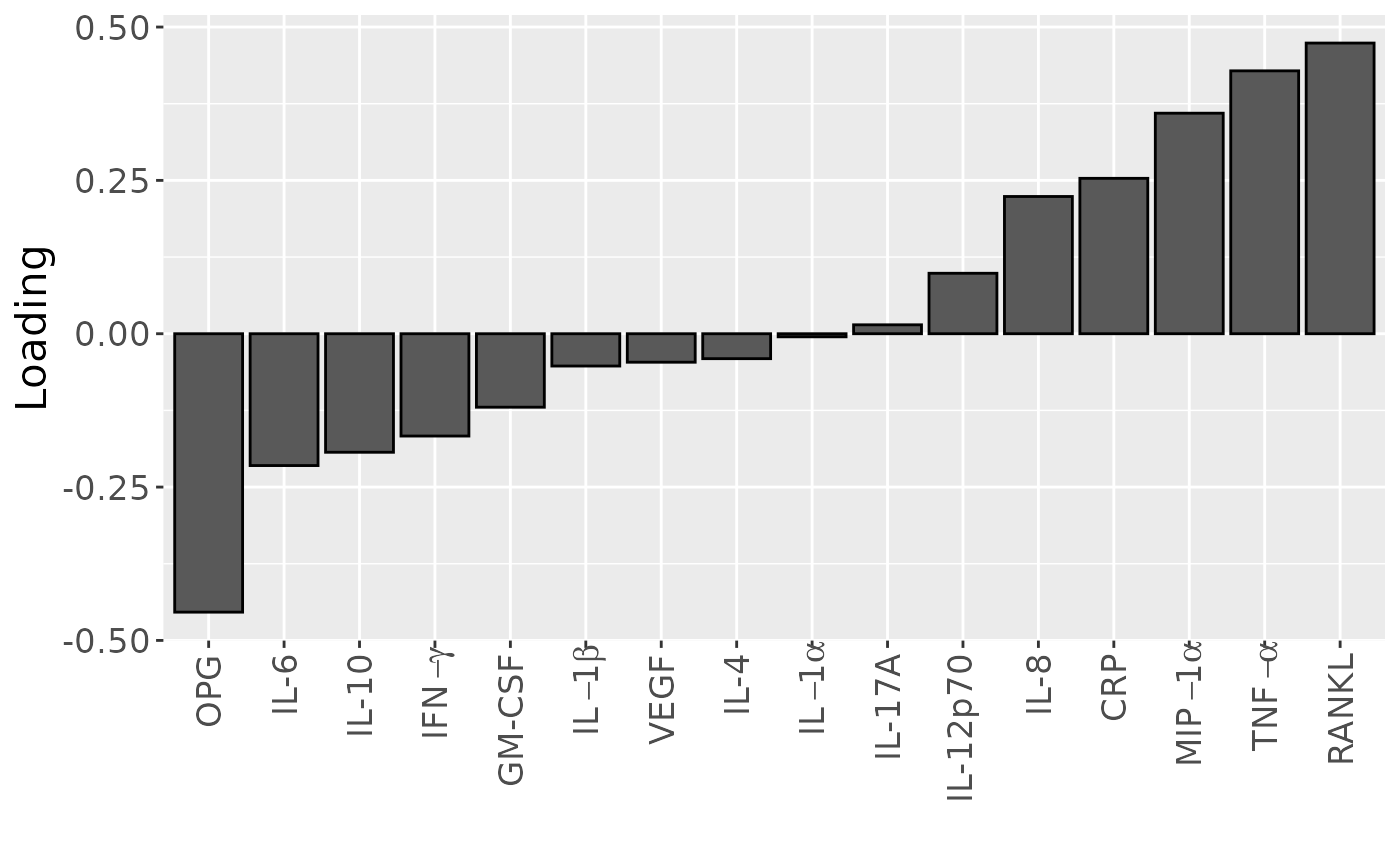
c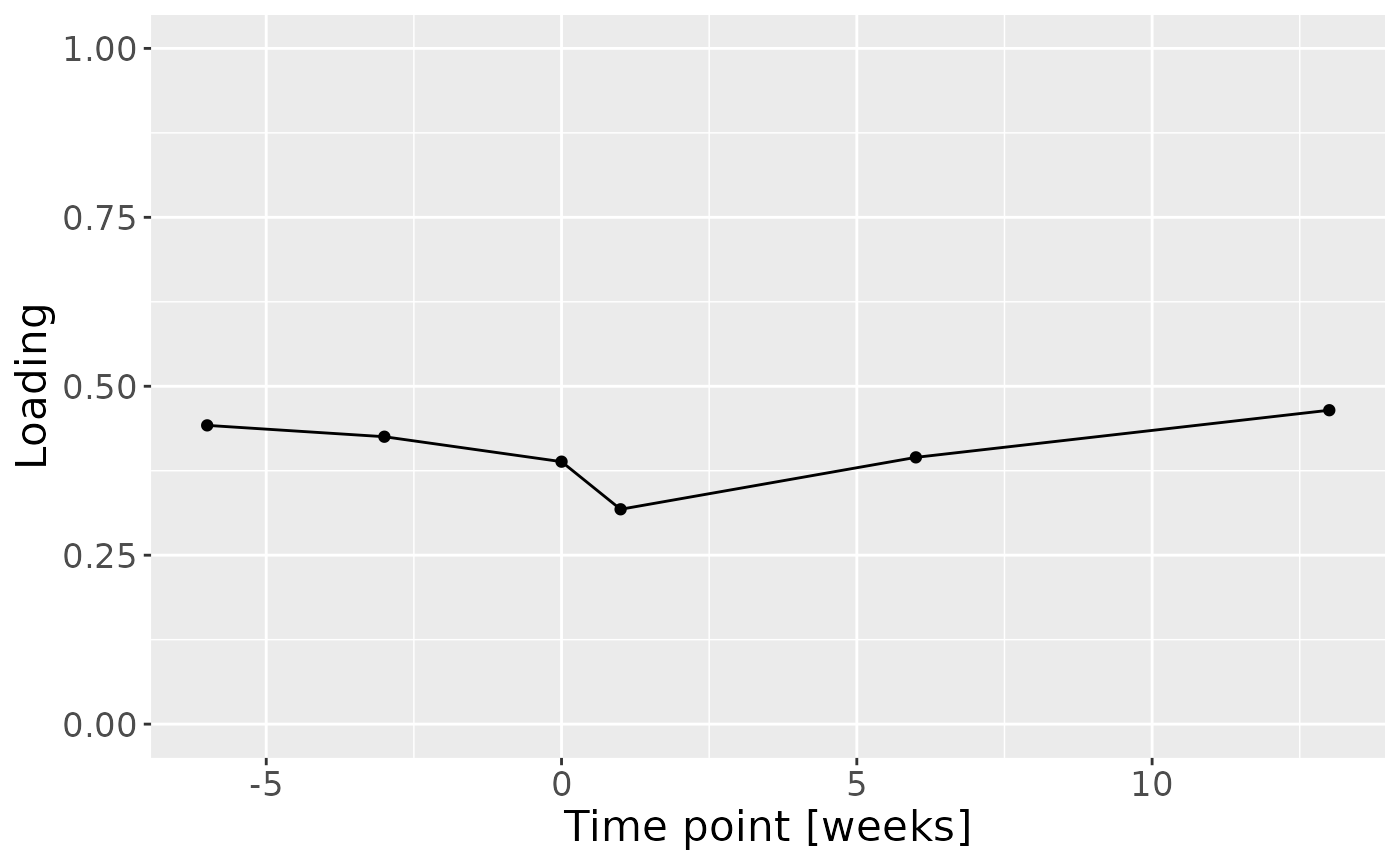
Positively loaded inflammatory mediators, including RANKL, TNF-alpha, MIP-1 alpha, CRP, IL-8, IL-12p70, and IL-17A had higher levels in symptomatic AP and lower levels in asymptomatic AP. Conversely, negatively loaded inflammatory mediators, including OPG, IL-6, IL-10, IFN-gamma, GM-CSF, IL-1 beta, VEGF, and IL-4 had higher levels in asymptomatic AP and lower levels in symptomatic AP. The time mode loadings of the model indicated that inter-subject differences due to pain perception decreased only transiently throughout the time series.